de-DEen-GB
Mikrostruktur
und mechanisches Verhalten des Schaumglases
 
von Dr. sc. techn. ETH Rudolf Trinkner
 
B.2. Tests regarding the mechanical properties of foam glass
 

In section 1.1 of this chapter, in a continuum-mechanical consideration, a linear-elastic behaviour of the glass base material of the foam glass up to fracture was assumed. On the basis of this assumption, it follows that any given foam glass body whose microstructure is based on the glass base material will also display a linear-elastic external fracture behaviour. Since as a result of this linear elasticity of the foam glass failure under given external load types occurs suddenly and without warning, we describe this phenomenon as brittle fracture, and say that foam glass behaves in a brittle manner.

In section no. 2 of chapter A it was described how the densities ρ=f (n) and the parameters n and L̅3 of the polyhedron foam glasses significant for further consideration depend significantly on the management of the production process. The same also applies for the tensile strengths  (n=0) and the elasticity coefficient E(n=0) and ν(n=0) of their glass base materials as well as for their morphologies.

From the facts mentioned above, and as a result of the unlimited number of possible standard processes for foam glass production, it can be concluded that an unlimited number of foam glass types differing with respect to their mechanical properties are possible. For this reason we have limited ourselves to the testing of the static properties of two fundamental polyhedron foam glass types; these are the fine-celled foam glass and foam glass types 1 and 2 produced by us in the laboratory.

For the experimental determination of the compressive-, tensile- and torsional shear strengths as well as the moduli of elasticity and Poisson’s ratios, the same standard

Fig. No. 49 Standard test piece

The circular cylinder defined above, which is the standard form for the production of the foam glass test pieces is a result of the balance between the opposing requirements for the largest number of largest test pieces which can be extracted from one foam glass sample.

The requirement for the largest possible test piece dimensions, which for polyhedron foam glass equates to the largest possible integral external and internal surfaces, equates, according to the “statistics of brittle fracture” of Franc A. Mc Clintock (15), to the requirement for small standard deviations between the individual measurements of the fracture strengths.

The selection of the circular cylindrical form allowed the test pieces to be extracted precisely from the foam glass samples with low scrap using a diamond core drill.

 
B.2.1.

The compressive strengths of polyhedron foam glass

Since the previously defined standard test piece has the slenderness ratio λ=10 with the dimensions set out in Fig. No. 49 and for this reason a uniaxial internal stress condition can be achieved with axial external compressive loading, this standard body was used for the test of the compressive strengths of the foam glass.

Fig. No. 50 shows a polyhedron foam glass test piece which has not yet been loaded in the loading unit of the test machine used by us. The 3 mm thick rubber plates which can be seen in the figure, located at both support surfaces of the test piece, prevent premature destruction due to uneven local compression.

In order to verify the correctness of this procedure, compression tests were also carried out with the thickness of the neoprene rubber support plates being varied. Here it was possible to determine that changes in thickness of the rubber support plates have no significant impact on the results of the compressive strengths. The test pieces which were not fitted with rubber support plates fared very poorly.

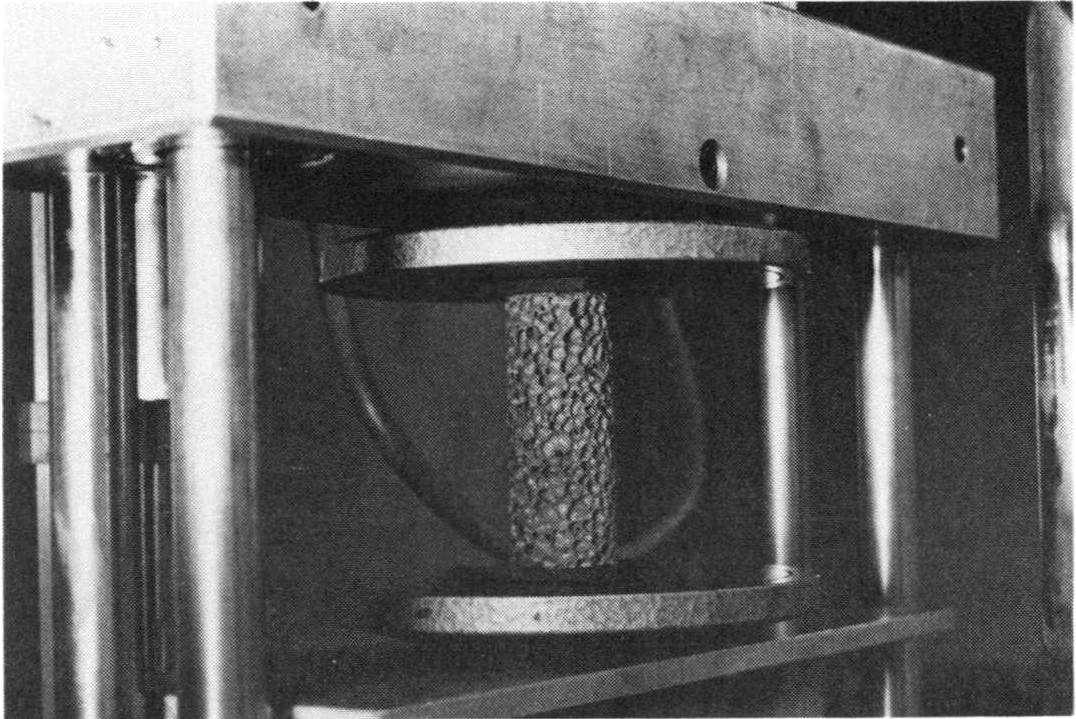
Fig. No. 50 Test pieces made of polyhedron foam glass in the loading unit for compression test

During the test of the compressive strengths σdB of the foam glass, the test always begins with the strains ε causing a linear increase in the compressive stresses σ in the test piece up to a sudden unannounced fracture at σdB, which can be seen in the associated stress - strain diagram Fig. no. 51 with a concurrent sharp drop in the compressive load.

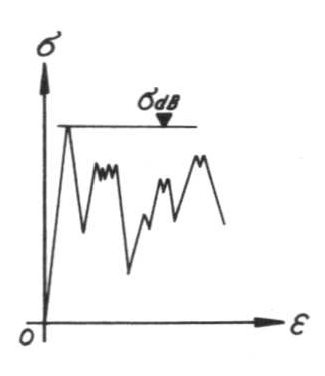
Fig. No. 51 Stress - strain diagram during the compression test

If the test process is then continued without interruption, then the test piece is crushed with a constant crackling noise, and with the applied compressive loads constantly varying around a lower level than the compressive strength σdB .

Through compression tests on test pieces with different geometries, is was possible to determine that their shape and size exert a not insignificant influence on their compressive strengths! For this reason, the compressive strengths measured in this was should only be considered as comparison values.

During the test process the velocity of the steel support plates shown in Fig. No. 50 was 1.2 mm per minute.

Special mention must also been given to the findings of how the linear stress-strain behaviour observed during every compression test up to fracture confirms the theoretically predicted validity of the linear-elastic fracture mechanics for the foam glass within the limits of measurement accuracy.

Table no. 1 contains the compressive strengths of the fine-celled polyhedron foam determined using the test method described above. From sixteen of the related pairs of values of density and strength included which were subjected to a non-linear regression analysis, for the fine-celled polyhedron foam glass we get the regression

87)σdB=16.24⋅ρ1,57+1.10

which relates the compressive strength σdB (N / mm2) with the density ρ (gr / cm3) and whose graph was entered on Fig. No. 26. The regression however is only assured in range 0.29 < ρ < 0.52gr / cm3. The tables No. 2 and No. 3 contain the observed compressive strengths of the foam glass types 1 and 2 using our standard method. The test results for the sample series of foam glass type 1can be summarised with the regression equation.

88)σdB=10.96⋅ρ1,07⋅e(0,0042 n-0.336 L̅3)+0.22

Here σdB (N/mm2) mean the compressive strengths, ρ (gr/cm3) the density, n(0/0) the porosity of the cell wall films and L̅3(mm) die "Mittleren Abschnittslängen" der Schaumglasart 1. the “mean section lengths” of the foam glass type 1. The regression is assured in the intervals

  • 0.26 ≤  ρ≤ 0.39gr / cm3,
  • 21n∗  4 2% and
  • 1.9 ≤ L̅3 3.8 mm

for the independent arguments.

Analogously for the sample series of the foam glass type 2 the following formula applies

89)σdB=20.43⋅ρ2.89𝚎(0.021 n-0.00016 L3)+0.74

Here, the following applies:

  • 0.26 ≤ ρ ≤ 0.34gr / cm3 ,
  • 15n 26%  und
  • 1.9 ≤ L̅3  2.6mm.

In the diagram on Fig. No. 26 the points were also entered, which belong to the test body, whose measured parameters σdB,ρ,n and L̅3 were included into the regression analyses leading to the formulae No. 88 and No. 89.

As was stated in section No. 2 of chapter A, for the fine-celled polyhedron foam glasses and the samples of type 2 - which were all expanded at comparatively low temperatures - a clear regression exists between the density ρ and the parameters n and L̅3. For the values n with relatively high expansion temperature profiles of the samples of foam glass type 1 however this no longer applies.

On the basis of these observations the hypothesis can be put forward that the structure (n=n(ρ),3=L̅3(ρ)) and therefore also the mechanical behaviour of given polyhedron foam glass types expanded at low temperature only depends in the main on their density ρ whilst this no longer applies with reference to the types expanded with relatively high temperature profiles (n≠n(ρ),L̅3=L̅3(ρ)).

With the above statements regarding the empirically determined relationships between the parameters nand L3 of samples of different polyhedron foam glass types and their density  as well as with the general dependency established with the aid of a comparison of the regression equations No. 87, 88 and 89

90)σdB=f (ρ,n,3)

the above hypothesis can be confirmed.

 
B.2.2.

The torsional shear strengths of polyhedron foam glass

Fig. No. 52

The circular cylindrical shape of the foam glass test pieces standardised previously for all static test types suggests that the resistance against pure torsional stress also be tested. An external axial torsion moment Mt acting on a foam glass test cylinder (see Fig. No. 52) causes shear stresses τ(r), in its circular cross-section, which in accordance with the well-known mechanical relationship

91)

increase linearly with the distance from the centre of gravity  of value  in the cross-sectional centre of gravity up to the largest value

92)

at the perimeter of the cross section (r=R). Here the polar moment of inertia of the cross sectional areas is

Fig. No. 53 Test setup during the determination of the torsional shear strength.

In the test unit shown in Fig. No. 53, the torsional moments  are transferred via rotationally symmetrical clamps to the foam glass cylinder. These clamps have been glued to the end surfaces of the foam glass test pieces before installation into the test unit using a gauge.

During the test a linear increase of the rotational moment as a function of the angle of rotation up to the value MtB at the point of sudden fracture can be observed. Here with each torsion test the velocity of the relative rotation of the test cylinder ends was 0.20 degrees per minute. At the moment of failure of the test piece, the edge stresses reach the torsional shear strength

93)

with

Fig. No. 54 The typical fracture surface with a torsional test.

Fig. No. 54 shows the typical torsional fracture surface which forms during each test suddenly and without warning.

Table No. 1 contains the torsional strengths of the fine-celled polyhedron foam glass determined with the test method described above. From five of the corresponding pairs of density and torsional shear strength included, we get the non-linear regression

94)τB=20.70⋅ρ3.12+0.21

which equates the torsional shear strength τB(N / mm2) of the fine-celled polyhedron foam glass with its density ρ(gr / cm3) and whose graph has been added to the diagram in Fig. No. 31.

 
B.2.3.

The tensile strengths of polyhedron foam glass

Fig. No. 55 Setup of the tensile test

Fig No. 56

The Figs. No. 55 and No. 56 shows the photographs of the test equipment setup used for the test of the pure tensile strength of the foam glass. At both end surfaces of the test piece (standard test body), two circular cylindrical steel caps have been glued using epoxy resin. These allow correct application of the external axial tensile forces onto the test piece. In order to achieve pure uniaxial stress conditions as closely as possible during the test, ball joints were arranged on both sides of the test piece.

During testing a linear increase of the applied external tensile forces can be observed from strain ε to up to the value NB at the moment of sudden fracture. Here, for each tensile test, the velocity of the extension of the test cylinder axis was 0.12 mm per minute. At the point of failure of the test piece, the normal stresses reach the tensile strength

95)

F0 equates to the cross-sectional area of the test piece.

As Fig. No. 57 shows, the fracture generally takes place in close proximity to a bonding location. This phenomenon can be explained by the multi-axis stress condition in the close proximity of the bonding joints.

Fig. No. 57 The fracture surface with a tensile test

Table no. 1 contains the tensile strengths of the fine-celled polyhedron foam determined using the test method described above. From seven of the included associated pairs of density and tensile strength we get the non-linear regression

96)σB=3.53⋅ρ1,44+0.01

which equates the tensile strength σB(N / mm2) of the fine-celled polyhedron foam glass with its density ρ(gr / cm3) and whose graph has been added to the diagram in Fig. No. 27.

 
B.2.4. The moduli of elasticity of polyhedron foam glass

Since the tensile strengths σB of the polyhedron foam glasses at constant density ρ take much smaller values than the associated compressive strengths σdB, their static moduli of elasticity  can only be determined in the compression test.

The sketch on Fig. No. 58 and Fig. No. 59 show views of the test unit developed by us.

Fig. No. 58 Setup of the measurement equipment for the determination of the modulus of elasticity of the foam glass

In order to achieve as clear a normal force application as possible to the foam glass test cylinders, the symmetrical measurement unit was supported using two balls within the compression frame of the Zwick machine.

Two inductive Philips displacement transducers of type PR 9310 were attached symmetrical to the vertical axis of the complete test unit, in order to determine the shortening of the test piece axis by measurement and evaluation of the vertical displacements of both the steel discs positioned left and right as a function of the load .

The test cylinders have all of the standard dimensions shown earlier on Fig. No. 49.

Fig. No. 59

Fig. No. 60 shows the block schematic of the electronic measurement system, which adds the signals of both inductive displacement transducers.

A calibration demonstrated that the unit length of 1 cm on the x-y-plotter in direction of the X-axis 3.11μ equates to shortening of the test piece axis and in Y-axis direction equates to the application of 61.50 N normal force application.

Fig. no. 60

Before every measurement of the modulus of elasticity, a preload of 200 N was applied with the Zwick machine to the test piece.

The velocity of the shortening of the test cylinder axis was always  mm / Min.

During the measurement process, the x-y-plotter independently records the graph P=f (/ΔL/) for each load cycle, which generally shows the following profile:

If Lo and Fo are understood to be the length and the cross-section of the unloaded test foam glass piece then under the load P the normal stresses are

97)

and the associated changes in length

98)

Finally by definition, the modulus of elasticity becomes

99)

For each test piece the moduli of elasticity were determined twice (the second time the test piece was rotated by 90° clockwise around its longitudinal axis), and the pair of values for  then determined.

The tables No. 1 up to and including No. 3 contain the results of the measurements carried out according to the methodology described above for the fine-celled polyhedron foam glass as well as the foam glass types 1 and 2.

In the diagram on Fig. No. 33 the points have been entered whose coordinates equate to the measured values ρ and E.

 
B.2.5. The lateral strain ν of polyhedron foam glass

Due to its low tensile strengths, the Poisson’s ratio of the foam glass could only be tested in the compression test. For this reason, the test unit used for the measurement of the moduli of elasticity E only needed to undergo minor modifications. The sketch on Fig. No. 61 shows a view of the setup.

The test pieces all have the standard dimensions set earlier on in Fig. No. 49. With the aid of a gauge, 10 mm thick steel discs were glued to the bottom and top surfaces of the test cylinders using epoxy resin.

In order to determine the Poisson’s ratio ν of the foam glass in a compression test the shortening of the longitudinal axis of the test cylinder and the concurrent increase in its diameter must be measured as a function of the load P. For this reason, the two inductive displacement transducers were arranged symmetrical to the cylinder axis, in such a way that their axes lie on the increase of the diameter through the test piece centre of gravity.

Fig. no. 61 Setup of the measurement equipment for the determination of the lateral strain ν of the foam glass

Since the extension ΔD of a diameter running through the centre of gravity of the test piece is sought, the signal of both inductive displacement transducers have to be added. Thus the electronic measurement system used for elasticity modulus measurement (see block schematic on Fig. No. 60) could be reused.

A calibration showed that the unit length of 1 cm on the x-y-in the direction of the x-axis 1,22μ equates to an increase in the diameter of the test cylinder diameter and in the direction of the y-axis y equates to 61,47 N of normal force application.

Before the actual measurement, each test piece was pre-loaded with a force of 200 N. The velocity of the shortening of the test cylinder axis was always equal to  mm per minute. During the measurement process, the x-y-plotter independently records the graph P=f (ΔD) for each load cycle, which generally shows the following profile:

If Do and Fo are understood to be the diameter and cross-section of the unloaded foam glass sample, under a load of P in the foam glass the values of the normal stresses is

100)

and the associated lateral strains

101)

Using this measuring unit however it is not possible to measure the elongation εI of the test cylinder axis. For this reason, the test pieces used for the modulus of elasticity measurement were reused, in order to gain the elongation εI of the test piece axis associated with P and εqq(P) with the aid of the measured E-modulus from the relationship

102)

numerically.

Finally, by definition, the Poisson’s ratio of the foam glass can be found as

103)

The tables No. 1 up to and including No. 3 contain the results of the measurements

of the Poisson’s ration ν of the fine-celled foam glass as well as the foam glass types 1 and 2 according to the methodology described above. In the diagram on Fig. No. 34 the points have been entered whose coordinates equate to the measured values ρ and ν.

Nach oben springen  
B.3.
Further influences on the fracture strengths of the foam glass