In the diagram on Fig. no. 62, the graphs of the compressive strengths σdB(ρ,n∗=0) predicted by the “TOP” model were added. The same diagram also shows the points whose ordinates correspond to the mass numbers of the compressive strengths σdB determined experimentally on the test pieces of the fine-celled foam glass as well as foam glass types 1 and 2. The correlation between the strength values σdB predicted with the “TOP” model and the measurement values observed on the test pieces is astounding! This concordance of the compressive strengths determined from theory and test applies in particular if (e.g. with fine-celled foam glass) only the membrane stresses in the “TOP” model are taken into account.
Fig. No. 27 shows the comparison of the experimentally determined tensile strengths σB of the fine-celled polyhedron foam glass with those predicted using the “TOP” model. With one exception, the measuring points added to the diagram lie below the theoretical course for the tensile strengths σB. They also have a large scatter. This phenomenon results from the fact that the test methods used underestimate the real tensile strengths and must also be partially evaluated as inadequate. In the diagram on Fig. No. 33 the empirically determined measurement points (ρ,Eν) have been entered. Each of them lies fairly exactly on the graph Ev(ρ,n∗), which is assigned to the corresponding parameter n∗=n∗(ρ)1).
The deviations between the predictions of the “TOP” model regarding the mechanical behaviours and the corresponding observations on real polyhedron foam glass samples seem to arise primarily from the management of the production process, which substantially influences the microstructure (morphology and stereology) of the foam glass as well as the mechanical properties of its glass base material ( (n∗=0)). The agreement between model and reality is given especially for foam glass types which were expanded at relatively low temperatures (fine-celled polyhedron foam glass or foam glass type 2). The edge lengths a 2) of the elementary polyhedra of the cell structures of the model polyhedron foam glasses “TOP” and “BETA” for theoretical reasons do not influence their mechanical behaviours. This is also confirmed by the clear regressions between the density ρ and the means sectional lengths L̅3 of the elementary polyhedra of the cell structures of all three foam glass types (fine-celled polyhedron foam glass, foam glasses type 1 and 2) (see diagram No. 8).
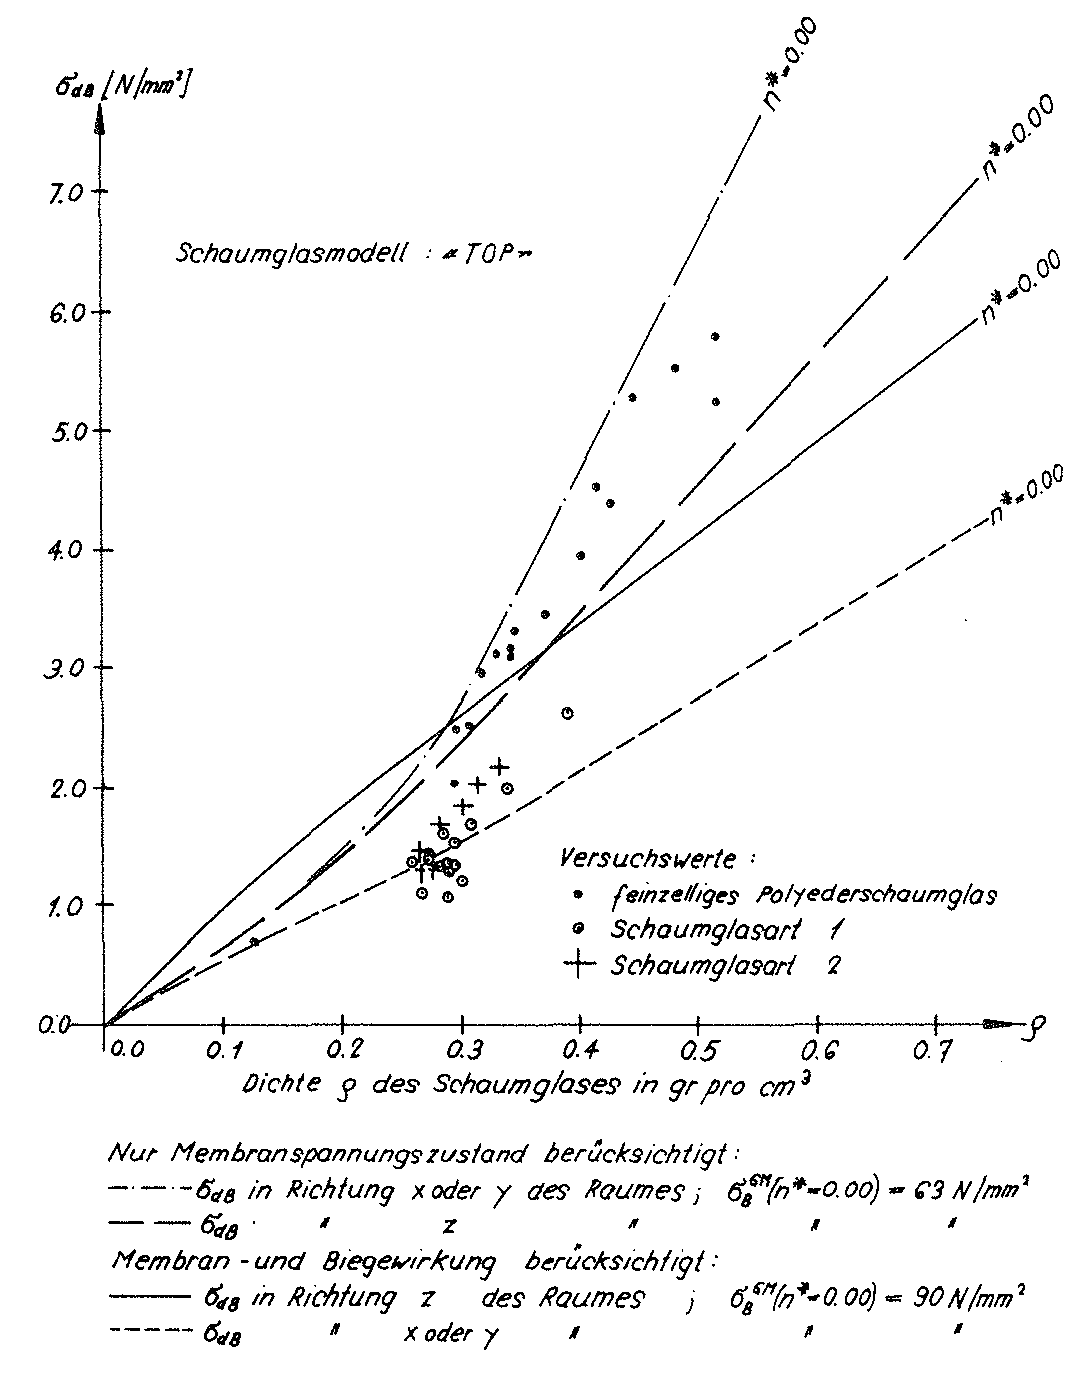
Fig. No. 62 The compressive strengths of polyhedron foam glass in theory and test
1) With the samples of the foam glass types 1 and 2, n∗ lies between 15 and 42 %.
2) The average sectional length of the elementary polyhedron of the “TOP” model foam glass is L̅3=1.69⋅а .